Overview
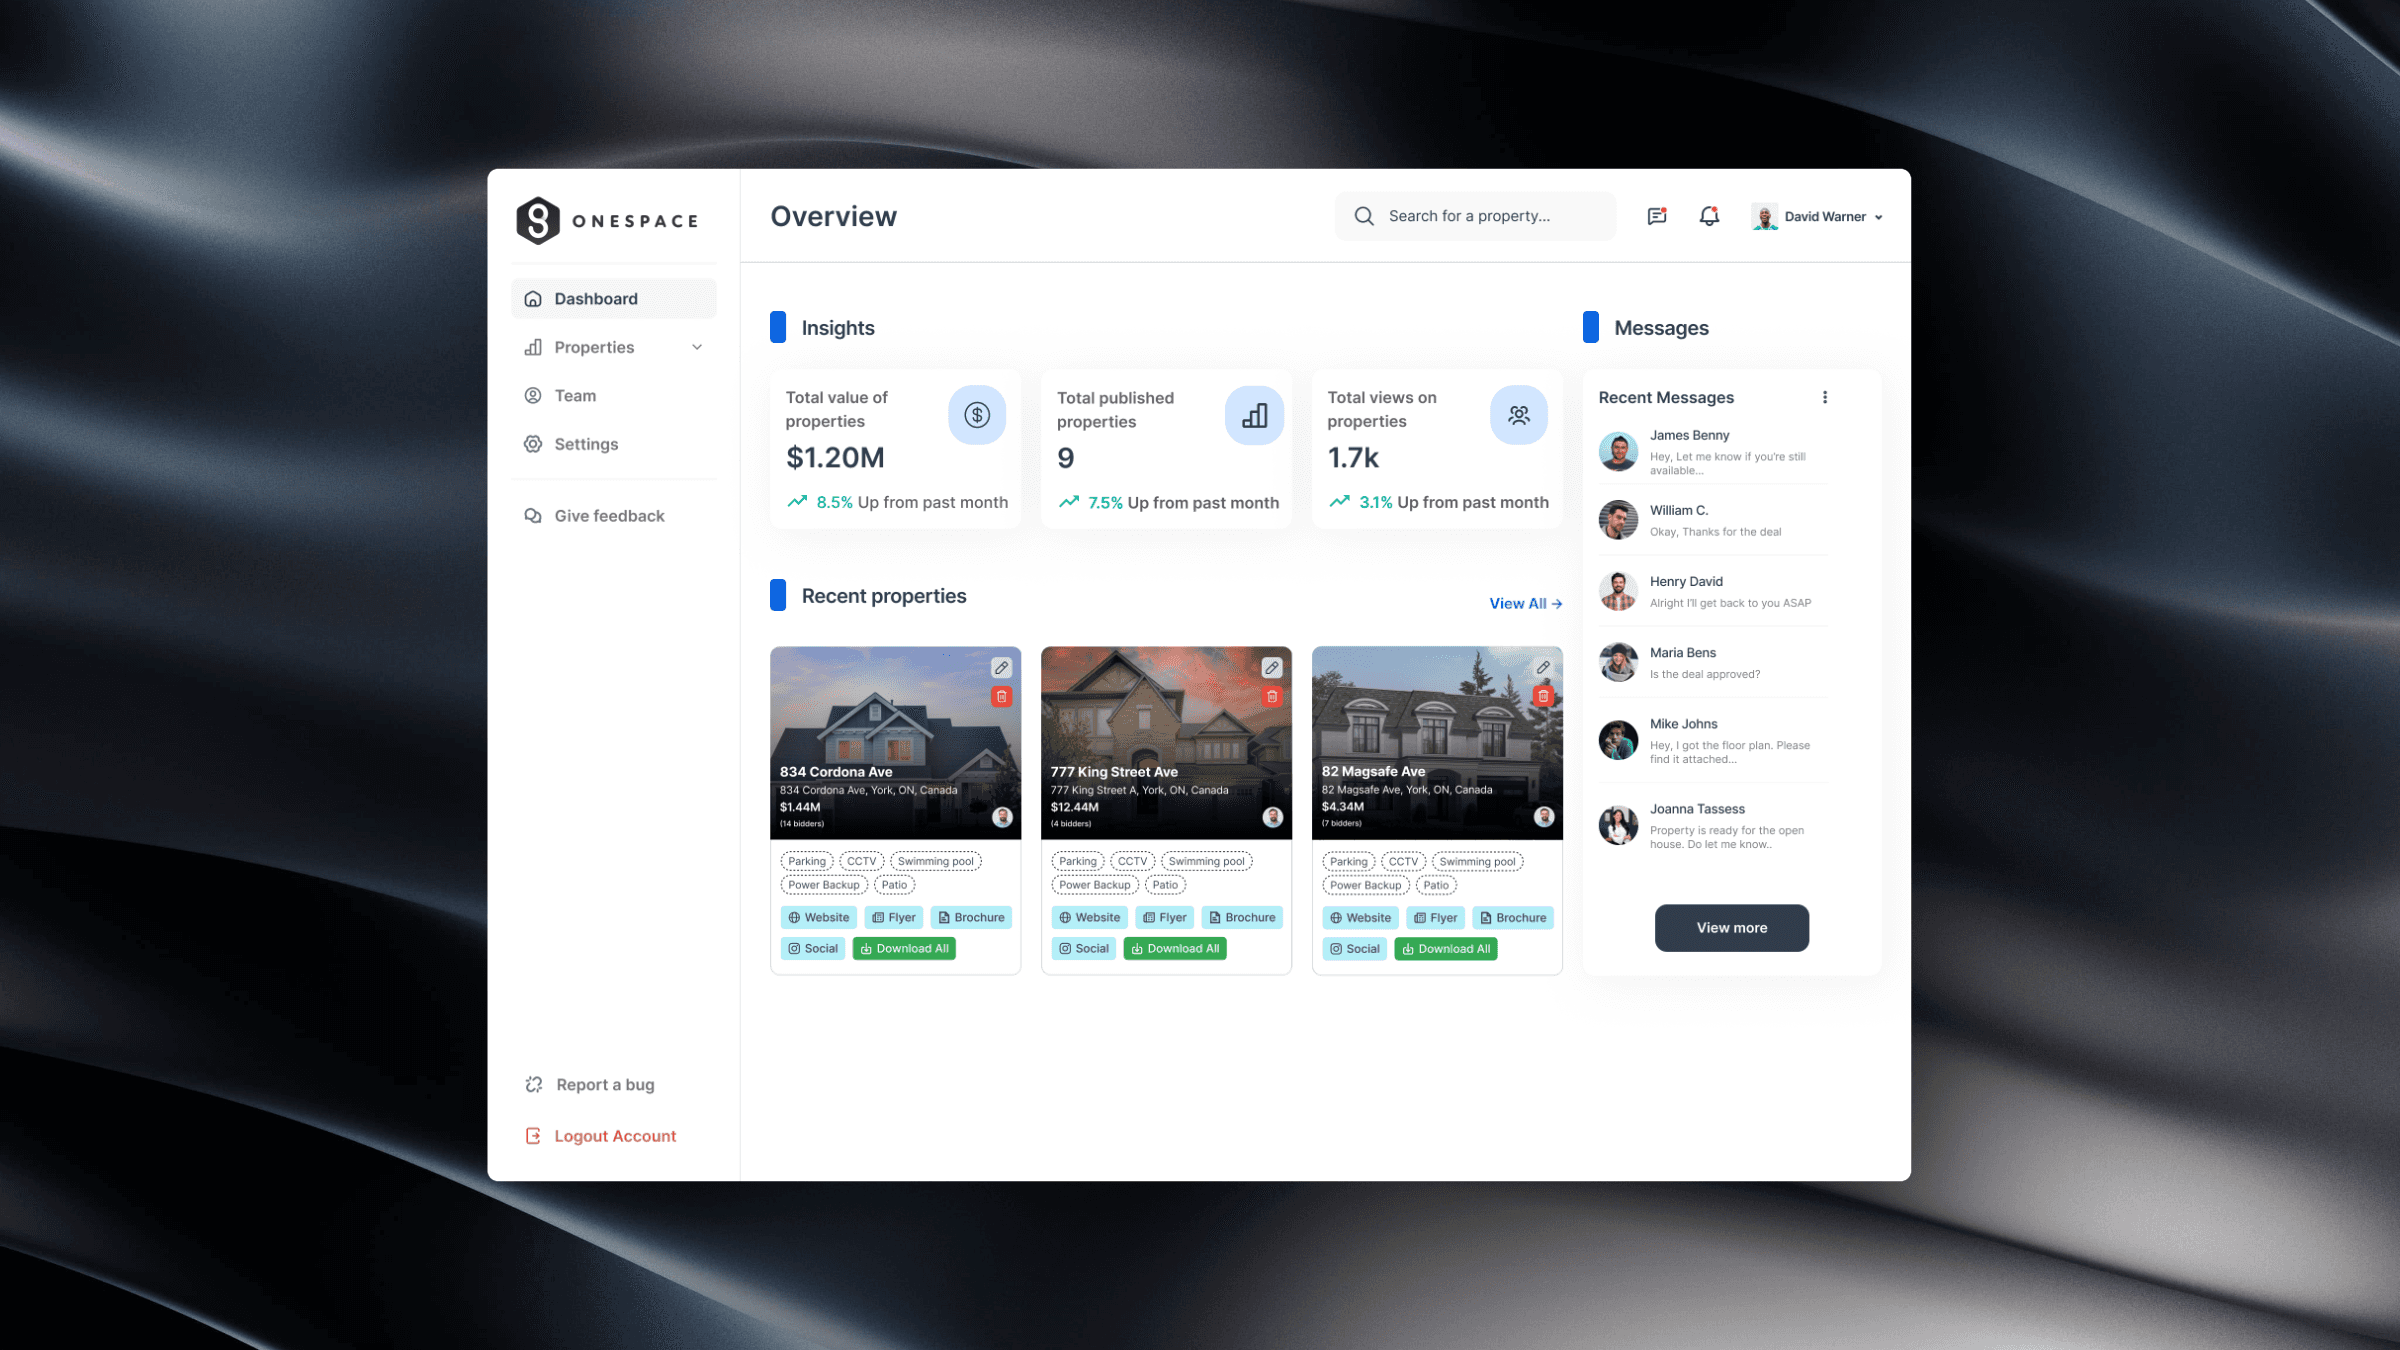
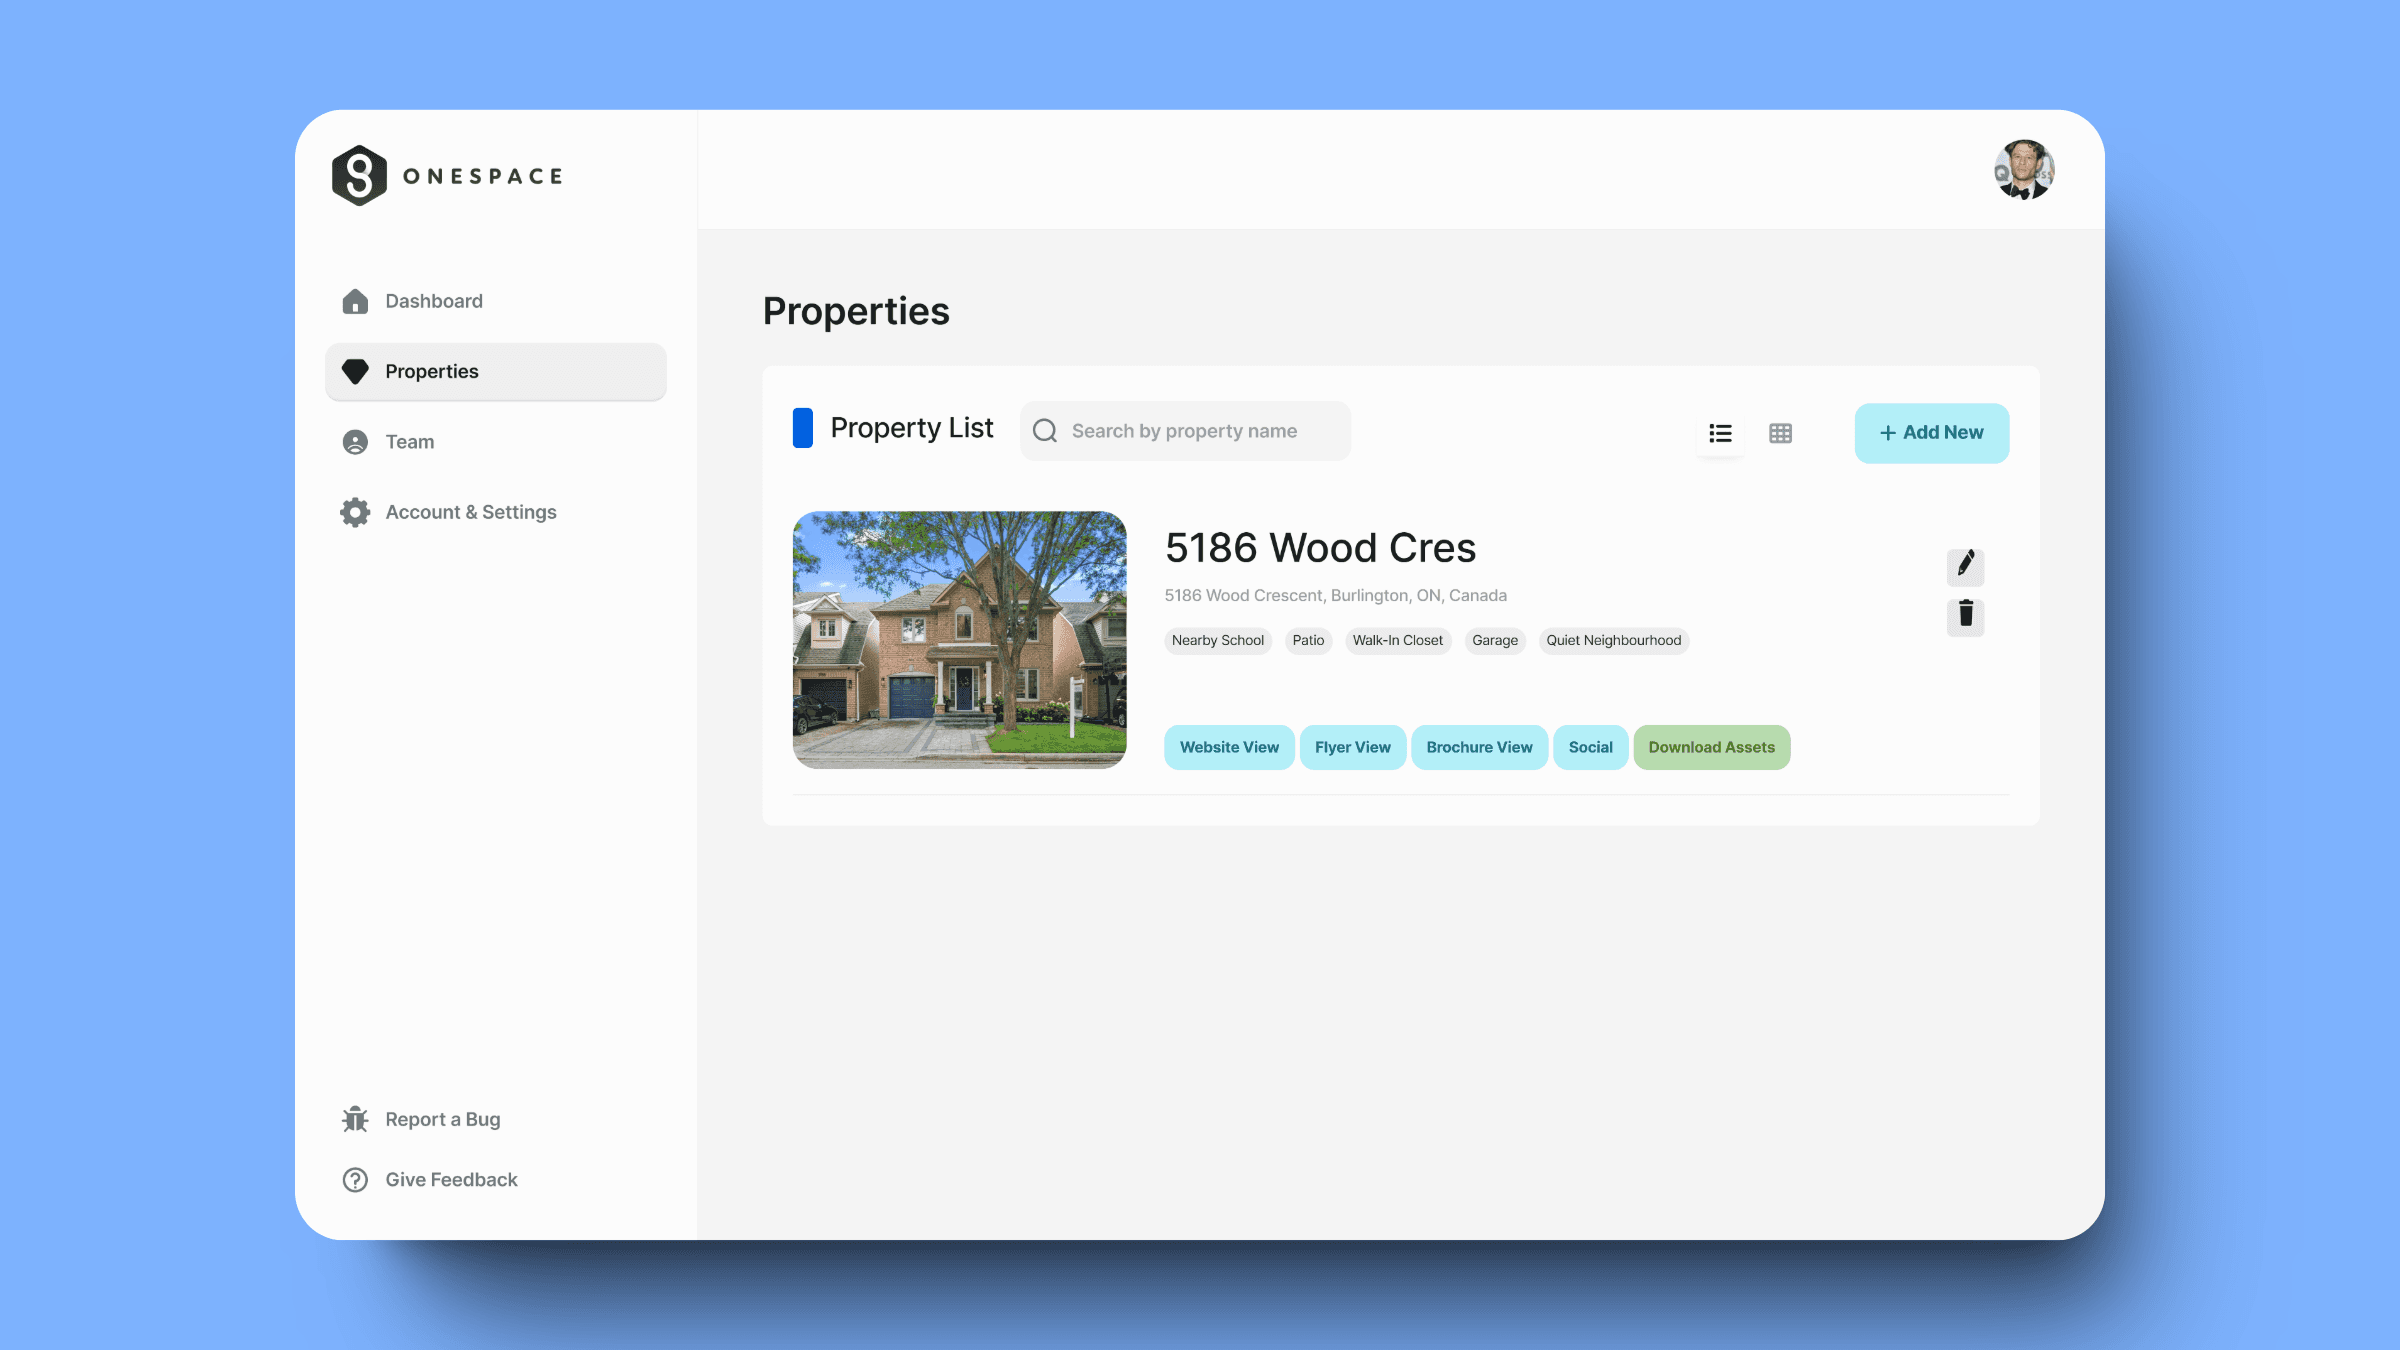
OneSpace is a real estate SaaS B2B dashboard technology aimed to provide marketing assets for real estate agents at the click of a button. I jumped in as the lead product designer, uncovering gaps in the dashboard, primarily focusing on 3 key user journeys for better usability.
Impact: Increased CSAT by 45%, task efficiency rate by 39% and navigation efficiency by 62%.
My Role
Lead Product Designer
Team
2 Product Designers | 2 Developers | 1 Product Manager | 1 Business Analyst
Duration
May ‘24 - Dec ‘24
Tools
Figma, Hotjar, SurveyMonkey
Problem
Real estate agents struggled to list properties on the platform due to the confusing form design, difficulty navigating system settings, and hindered access to digital assets, which reduced the overall user experience, leading to lower platform adoption.
Overview
OneSpace is a real estate SaaS B2B dashboard technology aimed to provide marketing assets for real estate agents at the click of a button. I jumped in as the lead product designer, uncovering gaps in the dashboard, primarily focusing on 3 key user journeys for better usability.
Impact: Increased CSAT by 45%, task efficiency rate by 39% and navigation efficiency by 62%.
My Role
Lead Product Designer
Team
2 Product Designers | 2 Developers | 1 Product Manager | 1 Business Analyst
Duration
May ‘24 - Dec ‘24
Tools
Figma, Hotjar, SurveyMonkey
Problem
Real estate agents struggled to list properties on the platform due to the confusing form design, difficulty navigating system settings, and hindered access to digital assets, which reduced the overall user experience, leading to lower platform adoption.
Process
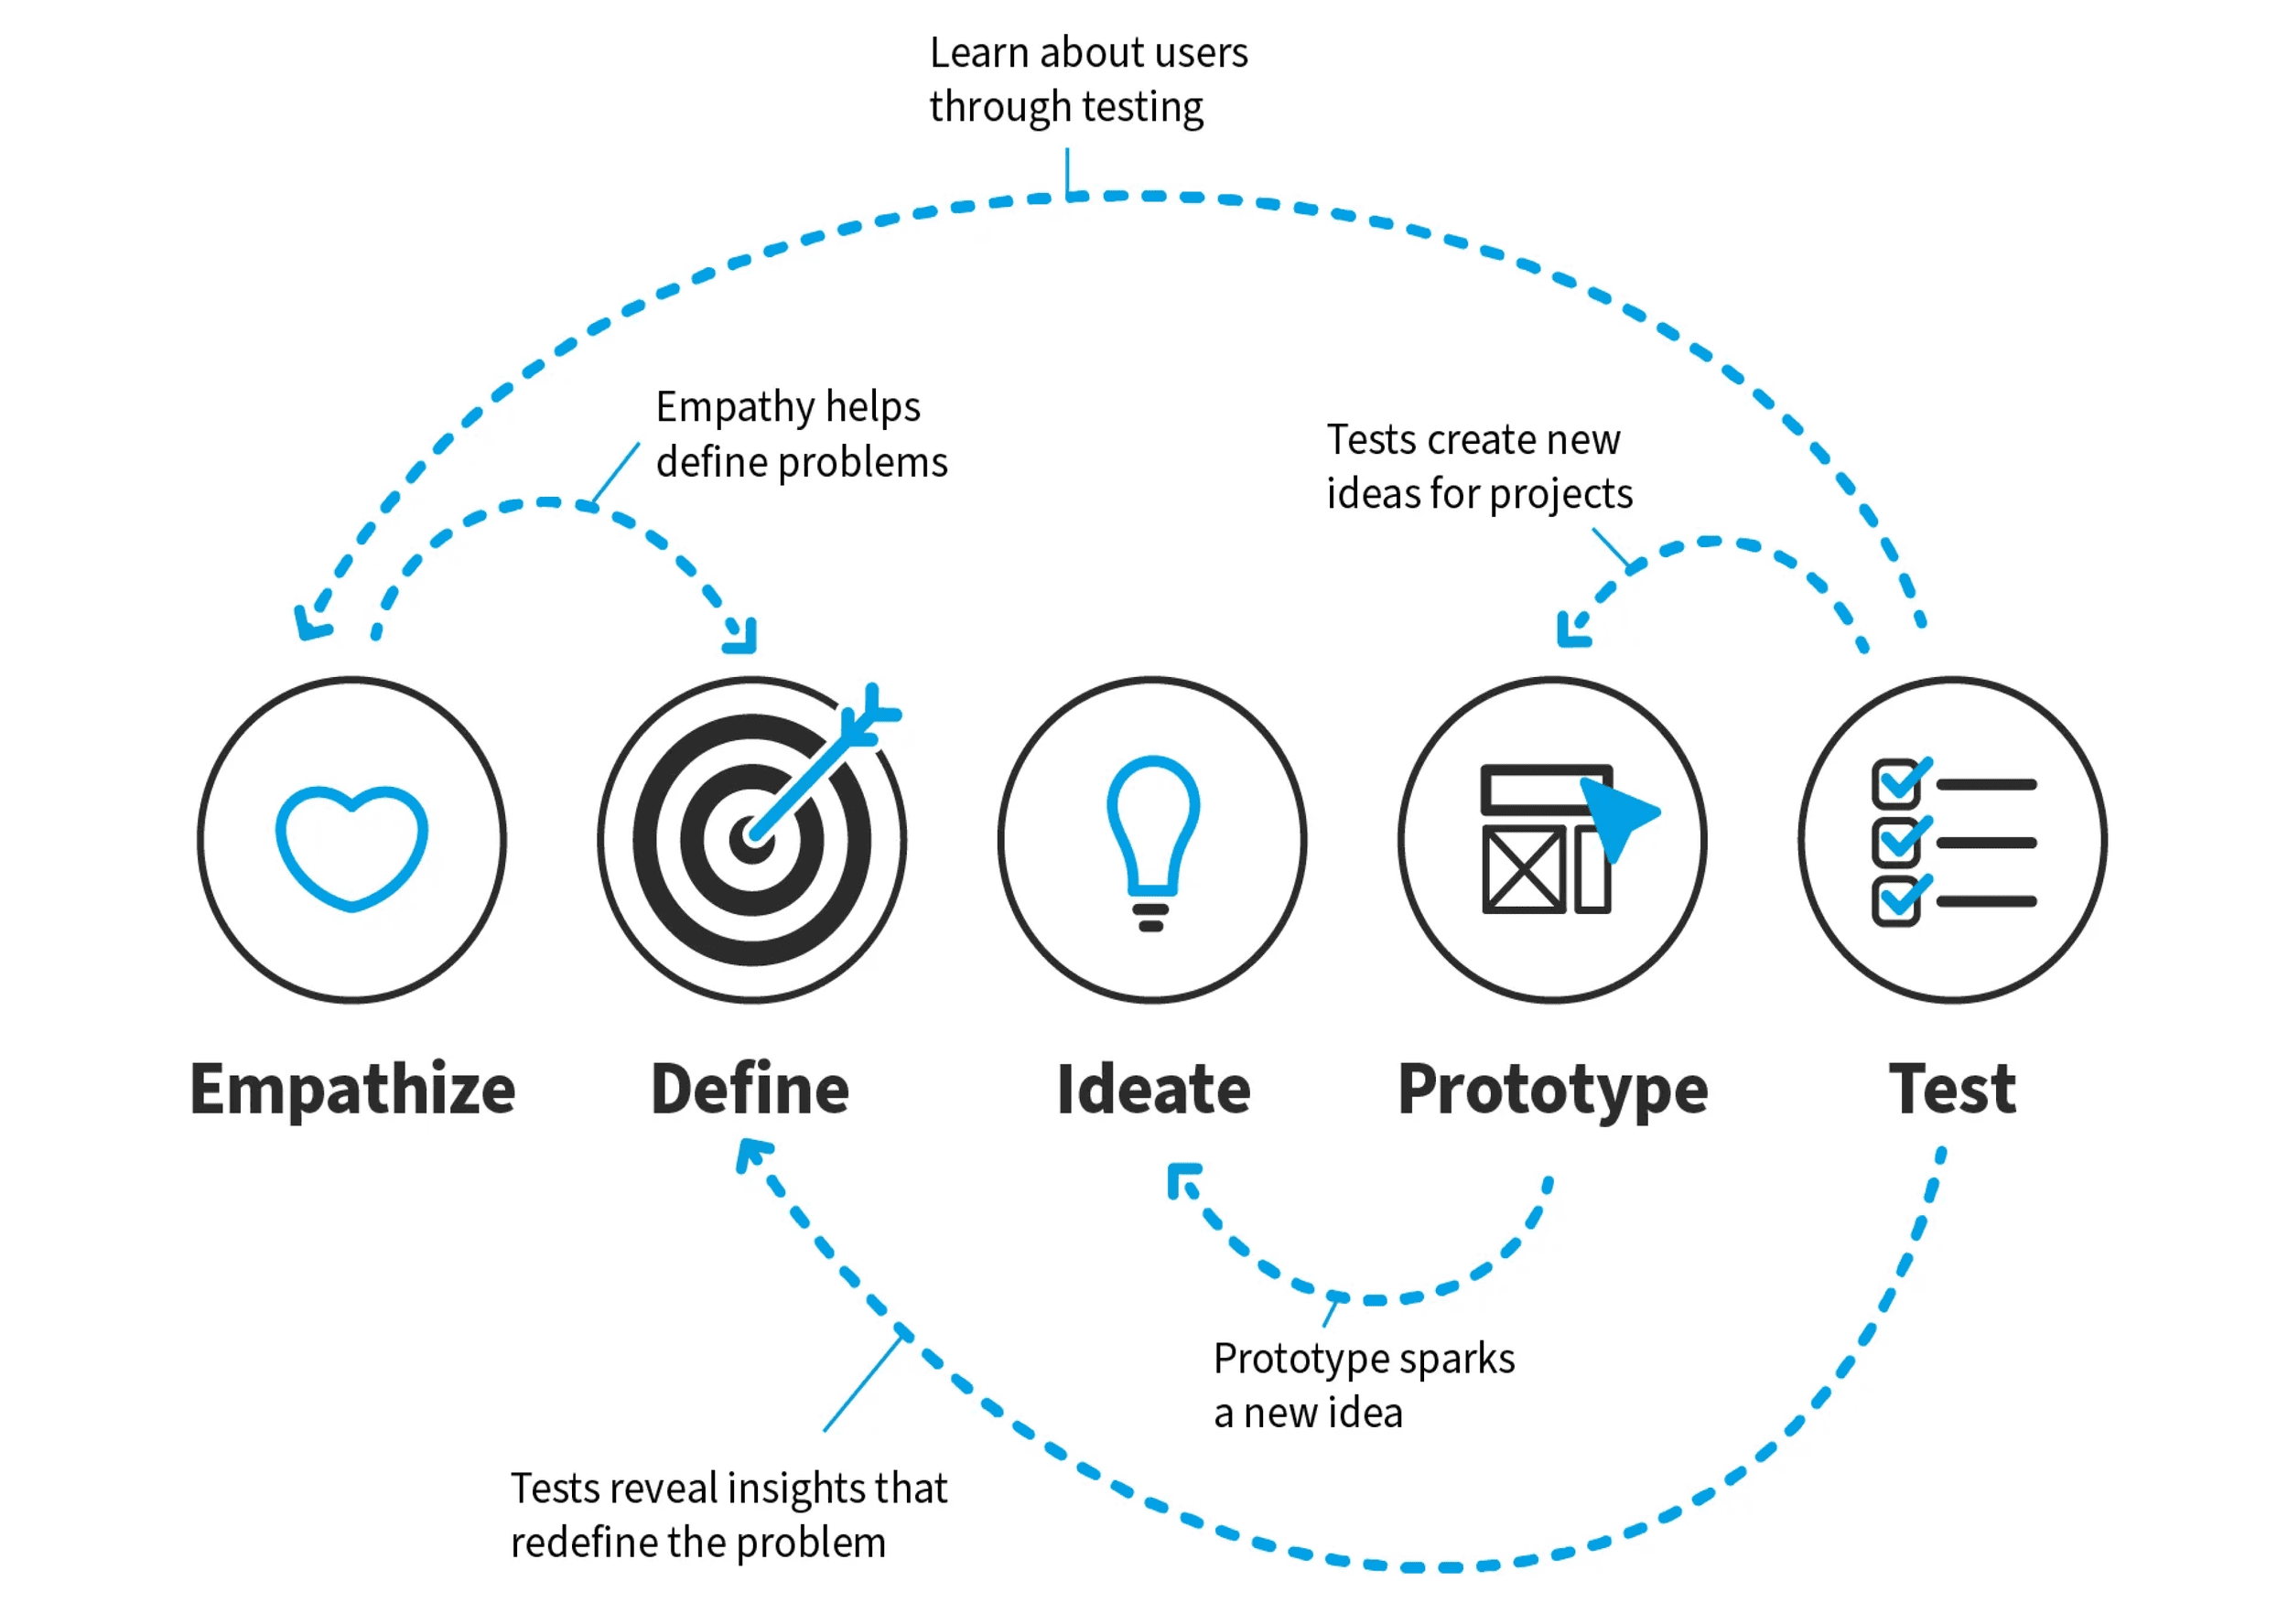
We adopted a Non-Linear Design Thinking Approach to address the challenges faced by our target users, as this methodology allows for flexibility, continuous iteration, and deeper empathy.
Measuring Success
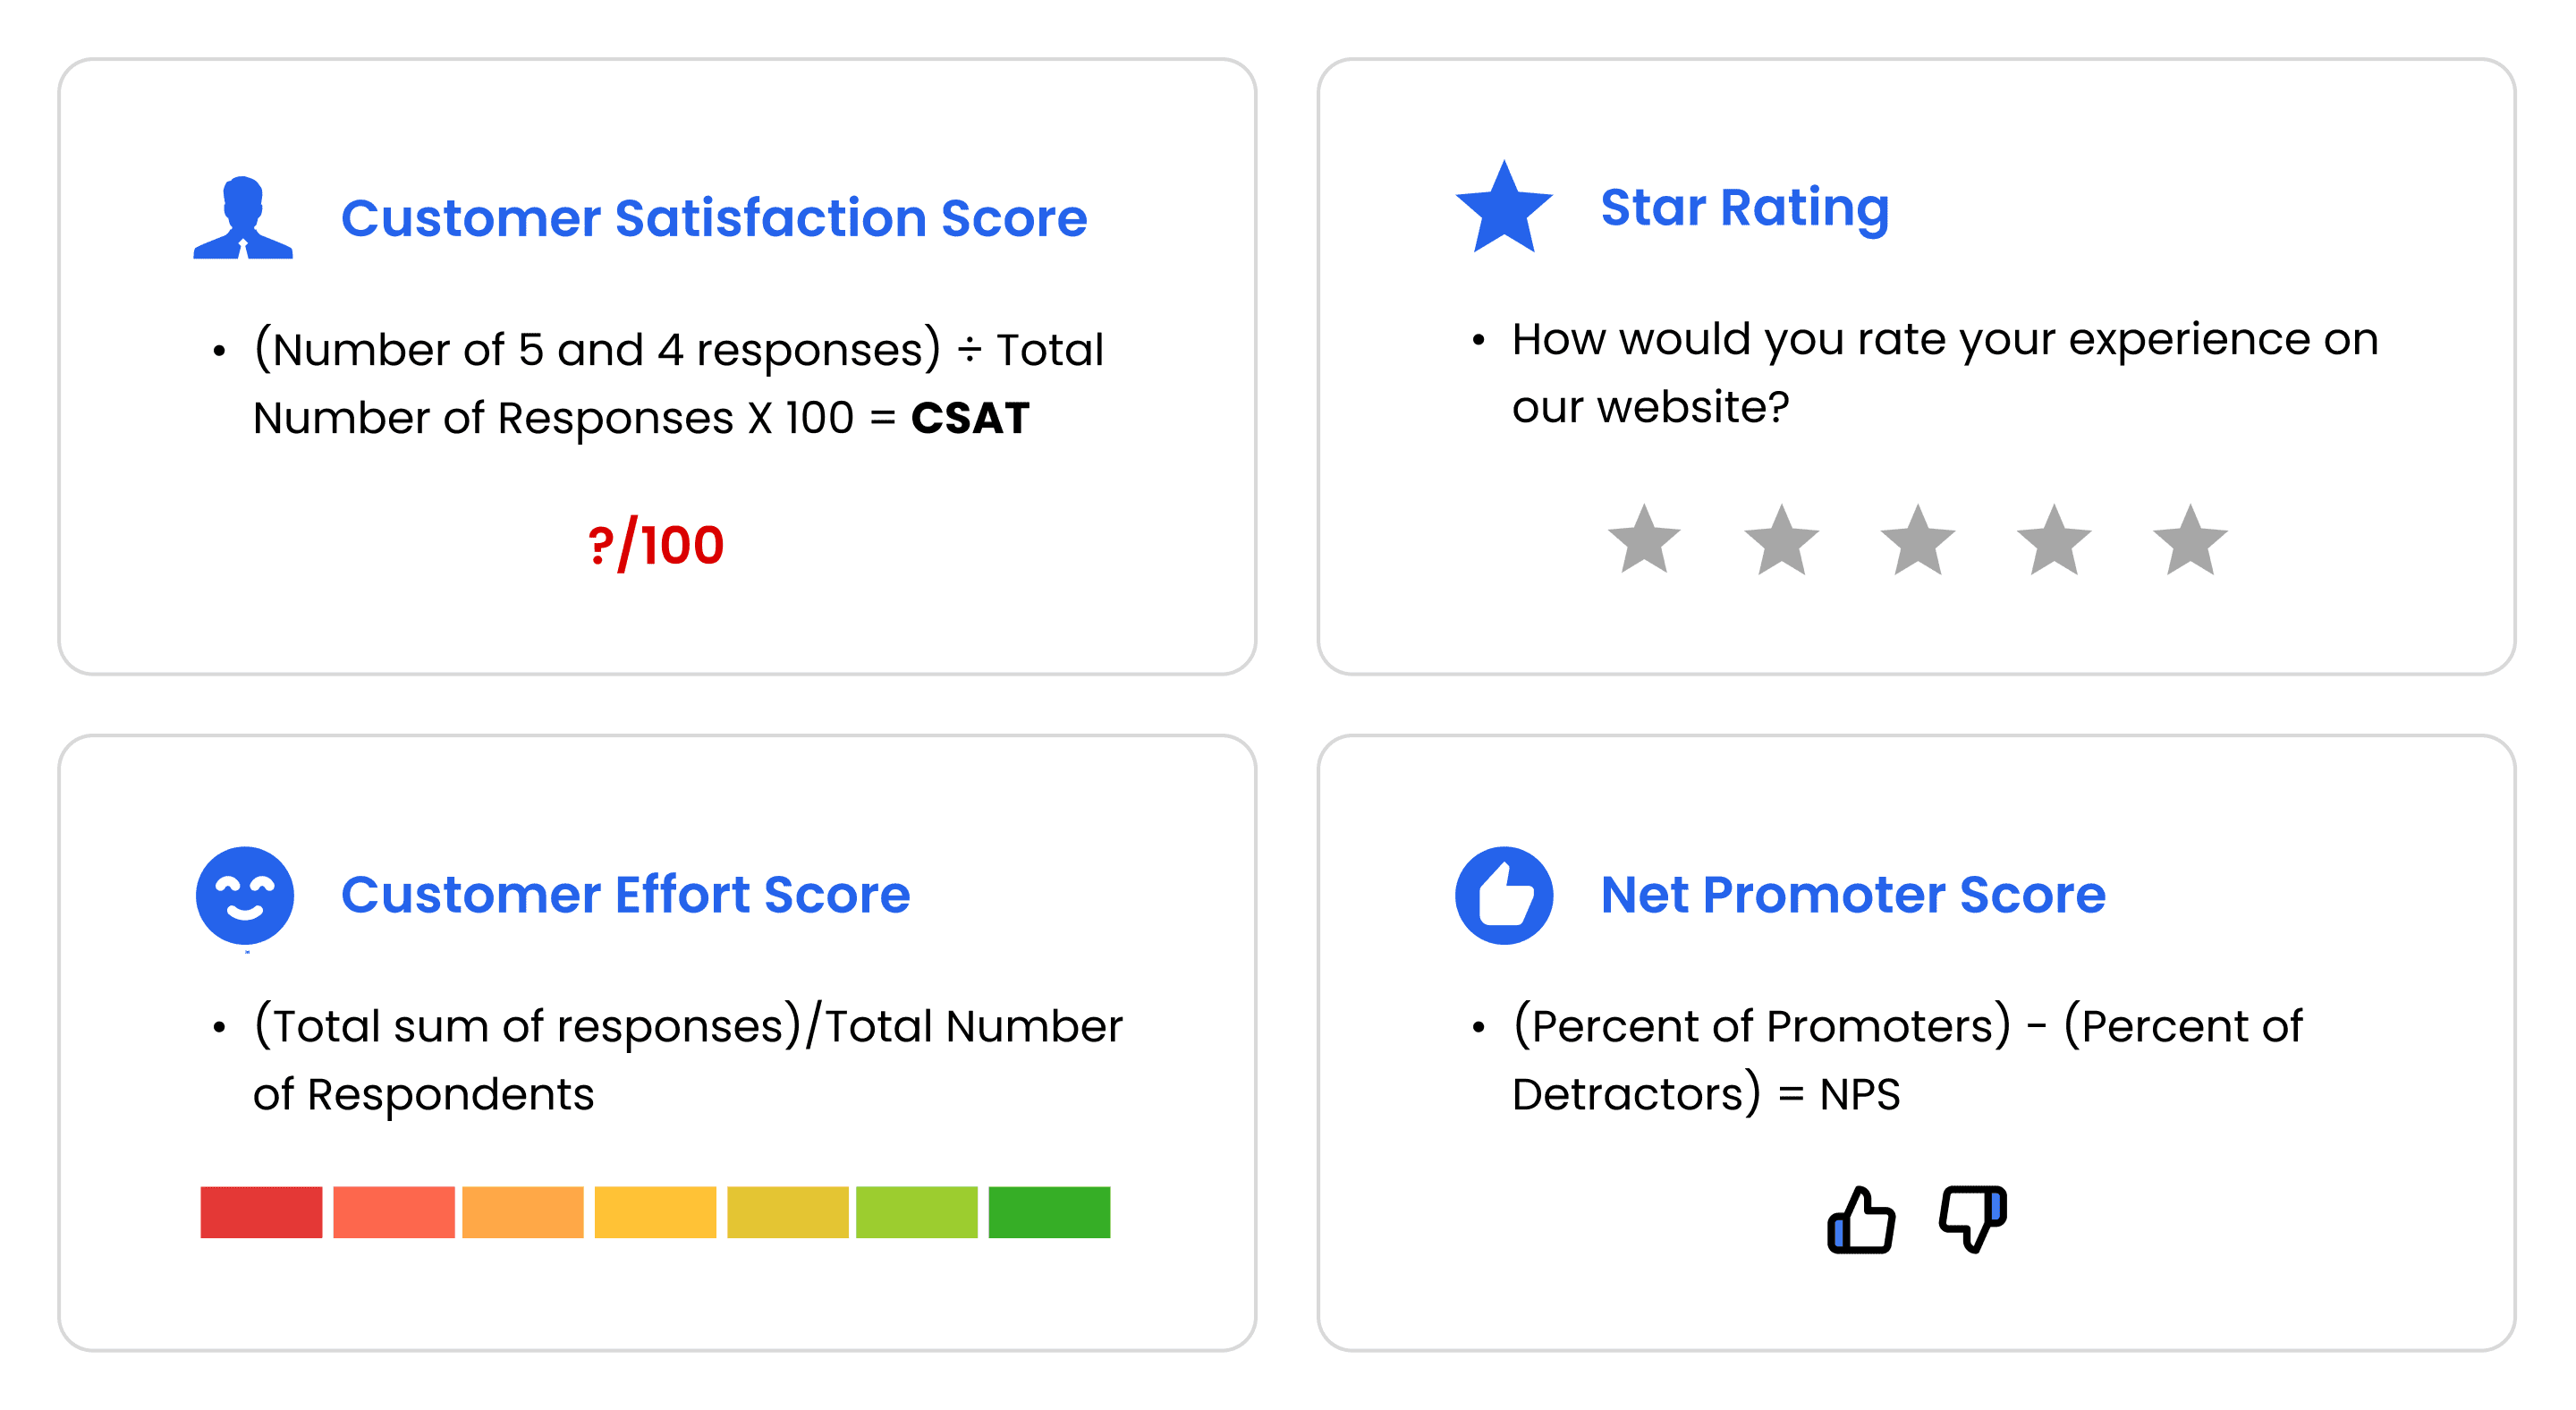
The primary goal of our redesign was to enhance customer satisfaction. To achieve this, we focused on improving key metrics identified by stakeholders, including CSAT, Star rating, CES for three primary user journeys, and NPS.
Research
To better understand how our users navigate, we kicked off our project with a deep dive into understanding the challenges faced by our target users. While we received primary research insights from the stakeholder, we decided to conduct additional usability testing to better comprehend the users' needs.
As a result, we focused on three key user journeys.
Listing a property.
Accessing marketing assets from the home screen.
Navigating to the settings menu.

Key Insights
We gathered key insights through a combination of methods, including user interviews, heuristic evaluations, and initial testing.
User interviews allowed us to directly engage with our target audience, understand their challenges, and capture their concerns.
Heuristic evaluations helped us assess the existing design against established usability principles, identifying potential areas for improvement.
Additionally, initial testing provided us with real-world data on how users interact with the dashboard, revealing pain points and opportunities for enhancement.
Design
After several brainstorming sessions with the internal team and synthesizing raw data through affinity mapping, our team identified three key themes to address.
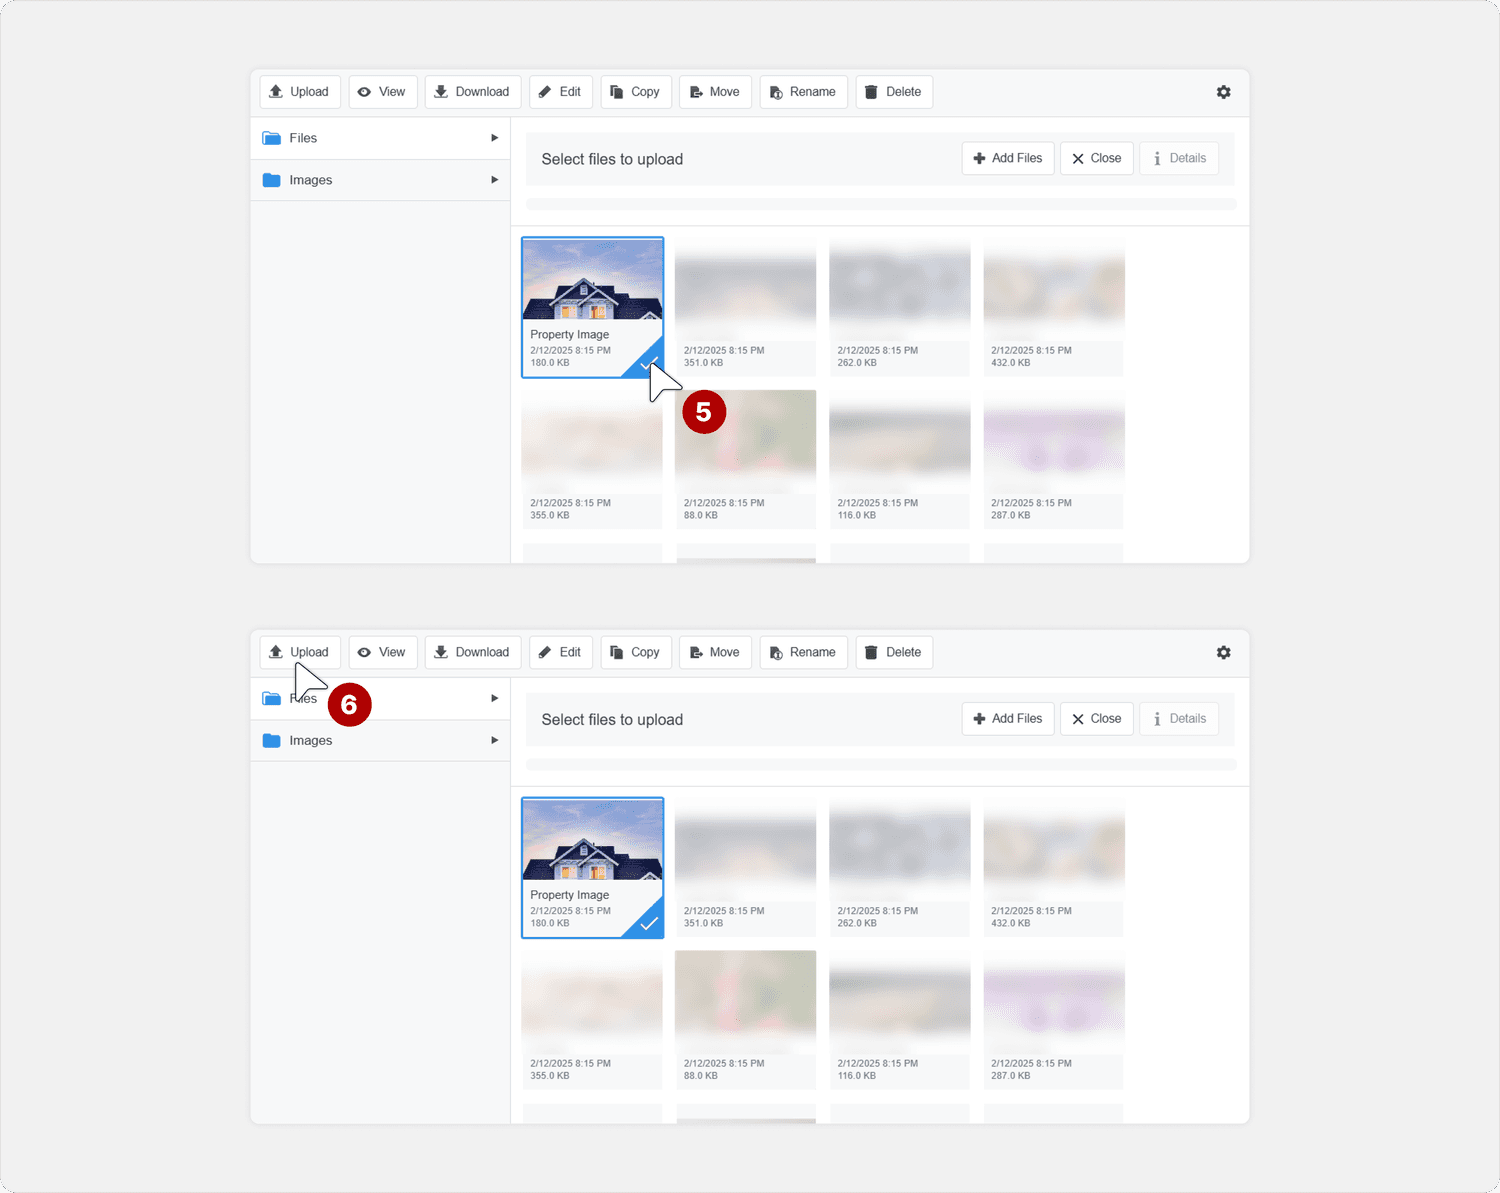
Increasing Task Efficiency rate by 39%. Initial 18 clicks was reduced to 11 clicks.
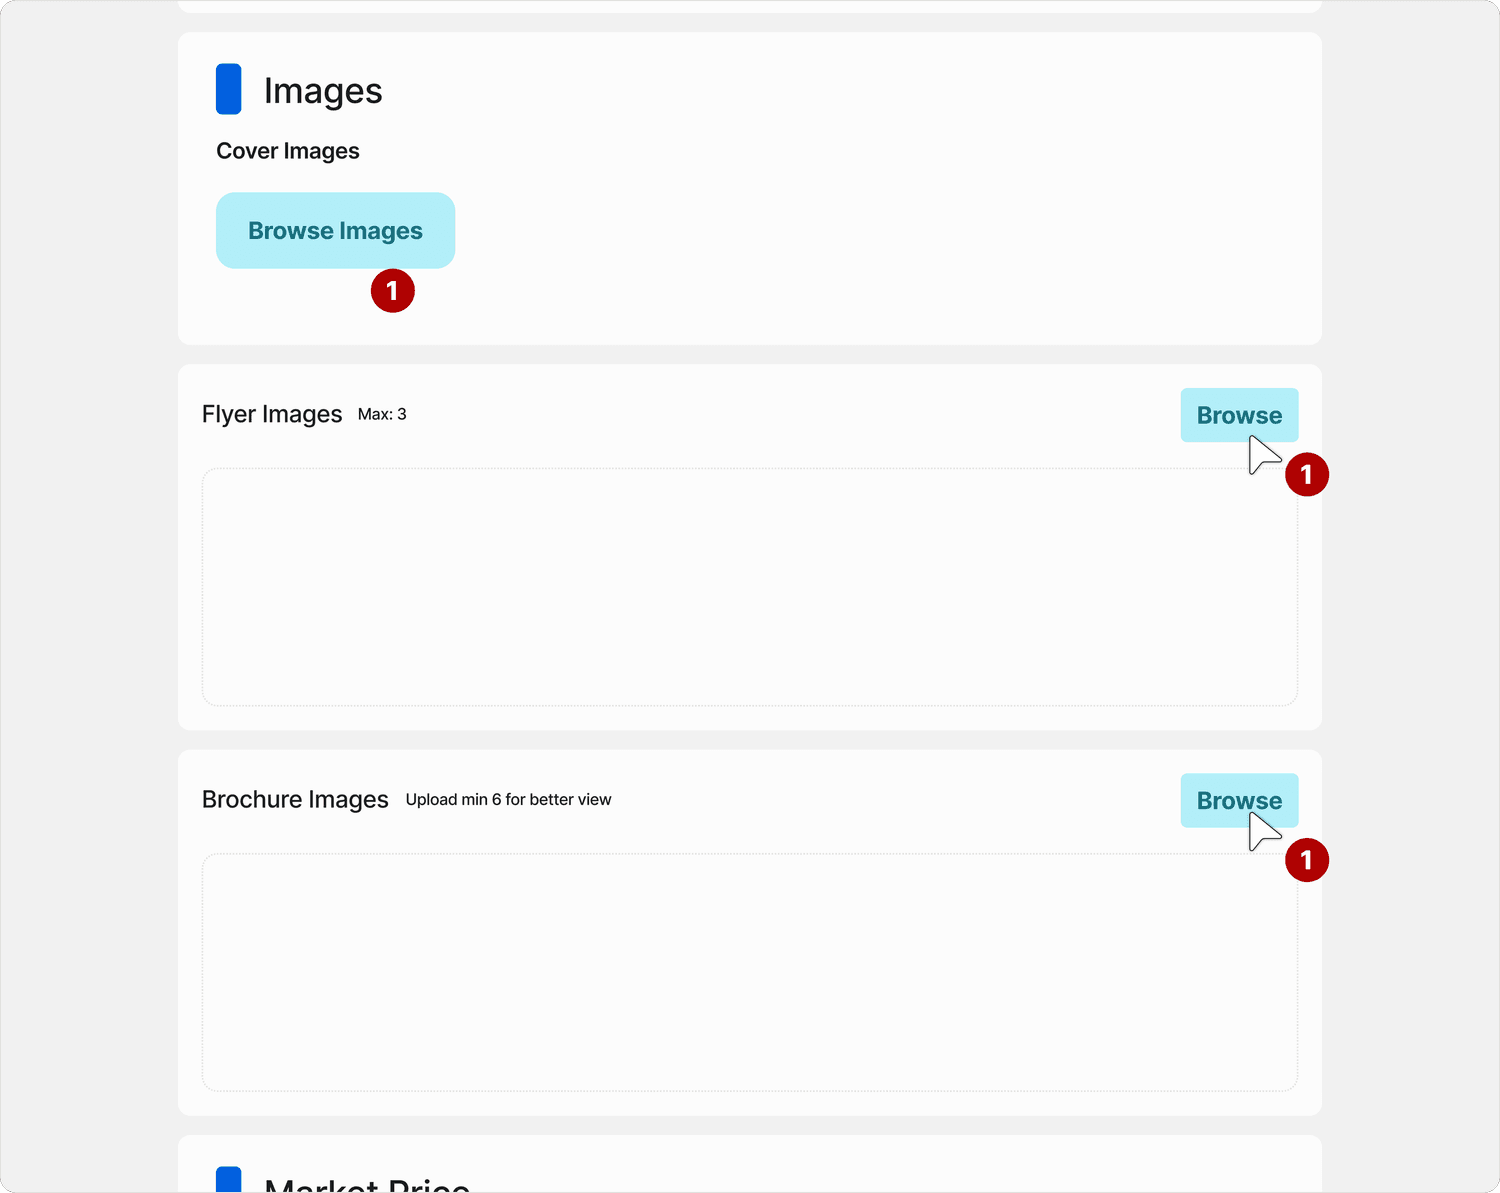
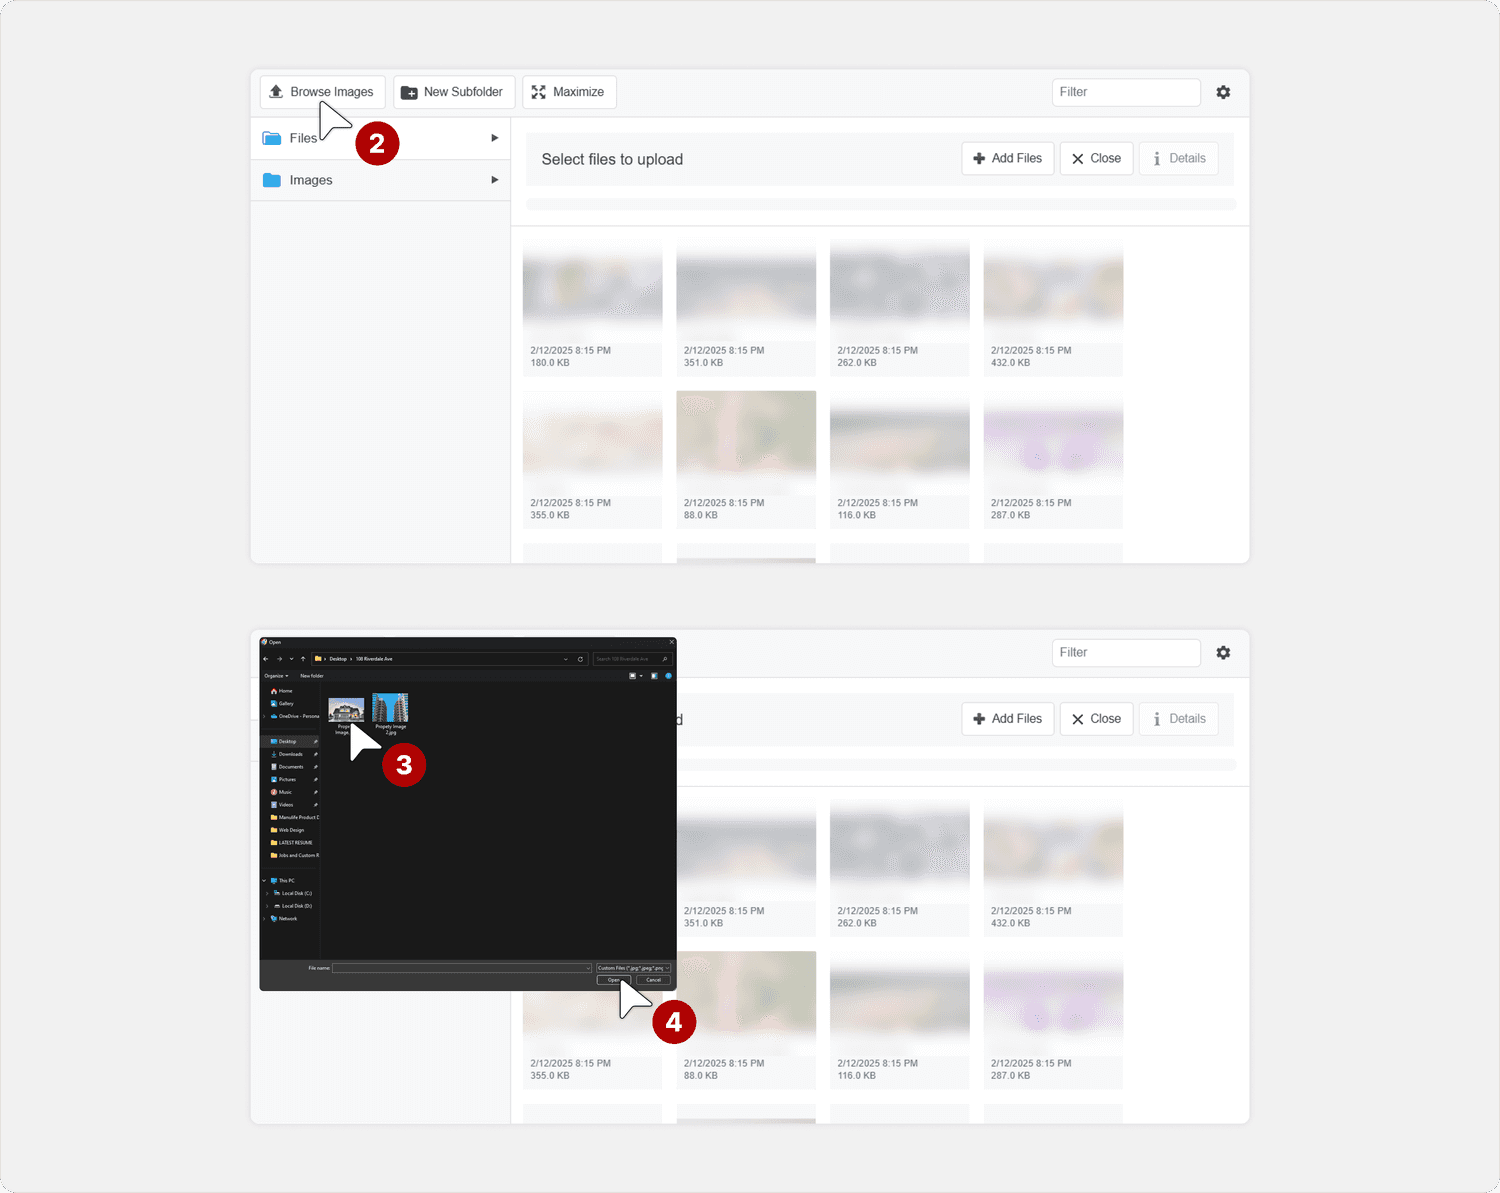
✘ The biggest struggle users faced in the Property listing form was uploading photos.
✘ The CKfinder tool and multiple sections for image uploads made it challenging and time consuming to upload property images, leading to frustration and inefficiency.